Posts

Showing posts from July, 2023

Module 4 – Coastal Flooding

Image
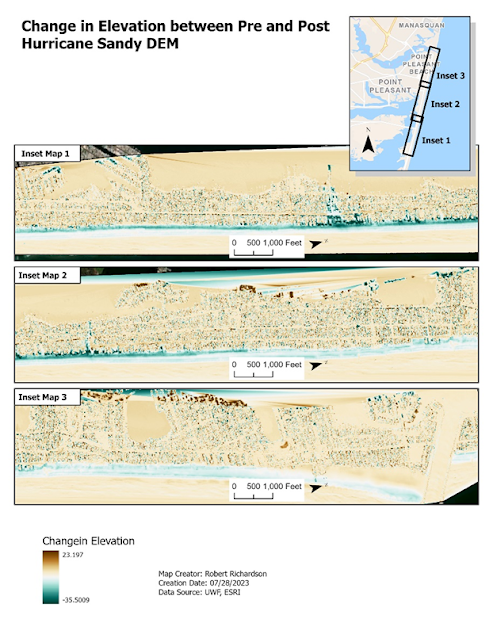
This module discussed the use of Digital Elevation Models (DEM) to delineate coastal flooding and determine storm surge. The first part of the lab was to look at the erosion due to Hurricane Sandy which went through Mantoloking, NJ in 2012. LiDAR files for pre-condition and post-condition were provided to do the analysis. The two files were first converted to TIN and then to raster datasets. The Post-condition raster was subtracted by the pre-condition raster to get the change in elevation between the two rasters. Below is a map showing the change raster. Below is a sample area showing erosion caused by Hurricane Sandy. The next part of the lab was to look at the effects of storm surge due to Hurricane Sandy in Cape May County, New Jersey. A Digital Elevation Model (DEM) of New Jersey was provided to do the analysis. Hurricane Sandy produced a 2-meter storm surge and utilizing the DEM we can determine the limits of the surge by selecting all areas less than 2-meters. Below is a m

Module 3 - Visibility Analysis

Image
Module 3 lab was all about visibility analysis, which deals with determining how well objects can be seen by an observer or observers given the 3D surface and height of other objects in the 3D scene. The module had us complete four ESRI online training courses that pertained to visibility analysis. Introduction to 3D Visualization This course discussed how to visualize 3D data in ArcGIS Pro using the scene viewer. The course discusses the difference between local scene and global scene views and when it is appropriate to use each of the views. The course also discussed that every object in a 3D scene needs an elevation source and that an elevation type needs to be chosen to display the object on the ground, relative to the ground, or use an absolute height. Extrusion can also be done on 2D objects to create 3D objects. The images below is a 3D scene of downtown San Diego with extruded trees and realistic multipatch 3D buildings. Performing line of sight analysis This course utili

Module 2 - Forestry and LiDAR

Image
Module 2 involved the use of LiDAR data from the Big Meadows area of Shenandoah National Park in Virginia to determine vegetation biomass above the ground. LiDAR is classified in a way that lets pull out both ground elevation and the top of the trees. By subtracting the two layers the tree heights and density can be calculated. The below map shows the LiDAR scene where red is higher elevation and blue is lower. The Digital Elevation Model (DEM) shows the ground elevation. The canopy density map shows the density of the vegetation. The Tree Heights map shows the tallest trees in dark green with the tallest tree being 163 feet tall. The chart shows the distribution of tree heights.

Module 1: Crime Analysis

Image
Part C of the Module 1 assignment was to create hotspot analysis of homicides in the City of Chicago using three different methods. All three methods would utilize a point feature class of the total homicides for 2017 and the City of Chicago boundary. A second feature class of the total homicides for 2018 would then be used to see how well the hotspot predicted the location of homicides. Grid-based thematic mapping This method utilized feature classes for the total homicides for 2017, the City of Chicago boundary, and a ½ mile grid cell clipped to the Chicago boundary. All three feature classes were added to a map. The Spatial Join tool was used to create a new feature class that would contain the count of homicides for each grid cell. The Select By Attribute tool was used to select only the cells where the number of homicides was greater than 0. Next, the count column was sorted and the top 20% was selected and then exported to a new feature class. The final feature class was diss

More About Me

Hello everyone! I am continuing my journey in the pursuit of a Masters in GIS Administration at the University of West Florida. I am just finishing up GIS Programming and just started the first week in Applications in Geographic Information Systems. This class should expand my knowledge and understanding of using GIS in real world situations, such as crime analysis, coastal flooding, damage assessment, visibility analysis, and watershed delineation. I have many years of experience using GIS on real world projects in my current position at the University of North Florida. I have worked with researchers on several projects that utilized traffic accidents in Florida, where I have built GIS models to analyze the data. I am currently working on several projects that are focused on reducing marsh erosion by restoring oyster beds to reduce the erosion. View my Story Map for more information. https://arcg.is/10r9Ca0