Posts

Showing posts from September, 2023

Module 2.2 Surfaces Interpolation

Image
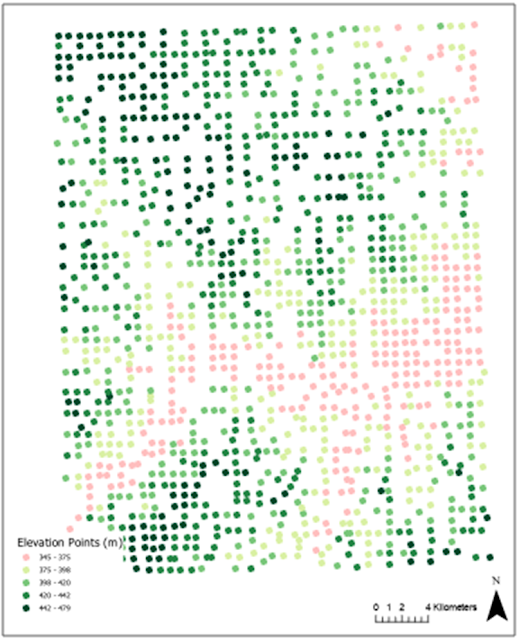
 The lab for this module involved the different techniques to interpolate a surface from a collection of sample points. The techniques discussed in the lab included Thiessen, Inverse Distance Weighting (IDW), and Spline. The Map below shows the elevation points used in the first part of the lab. The map below shows the surface created using the IDW interpolation. The map below shows the surface created using the Spline interpolation using Tension method. The map below shows the difference between the Spline and IDW interpolation with the elevation points overlayed. The illustrates that the points were in systematic pattern where the points are spaced uniformly across the study area. The smallest differences between the two interpolations are around the sampling locations. The differences between the spline and IDW interpolations increase as we move away from the sampling points. The second part of the lab was to compare the uses of different interpolation of a sample of points represen

GIS 5935 Lab 4 - Surface TINs and DEMs

Image
  Lab 4 of GIS 5935 involved using Triangulated Irregular Network (TIN) and Digital Elevation Model (DEM) to visualize the surface of the ground. A TIN represents the earth surface using linked irregular shaped triangles with three dimensional coordinates at each of the vertices. A DEM represents the ground as a two-dimensional raster where each grid cell has an elevation value. The first part of the lab was to drape an aerial image on top of a TIN. Below is an image of the Furnace Creek aerial drape over the TIN that represents the earth’s surface. The next part of the lab was to determine suitable land for a potential ski run using a provided DEM. This involved building a suitability model that ranked land based on elevation, slope, and aspect ratio. Each dataset was reclassified based on the rankings and then merged into one feature class using a weighted overlay. The following ski run suitability map shows the results. Below is map of a TIN that is shaded based on elevation and a