Posts

Showing posts from August, 2023

GIS 5935 Lab 1 - Calculating Metrics for Spatial Data Quality

Image
The first lab of GIS 5939 concerned spatial data quality and being able to determine if the data is accurate, precise, or has any bias. This involved understanding the difference between accuracy and precision. The horizontal accuracy of a point is determined by how close the collected points are from the true location. This is calculated by measuring the distance from the average of all points collected and the reference point. The larger the distance means, the lower the accuracy. The horizontal precision is how close different measurements are from each other. Points that are clustered together have high precision and points that are spread-out have low precision. The image below illustrates accuracy and precision. Image Source: https://byjus.com/physics/accuracy-precision-measurement/ The map below shows red dots for waypoints that were captured using an unknown GPS device. These 50 waypoints were captured using the same GPS and at the same location. The points should be at the sam
Module 6 – Corridor Analysis

Image
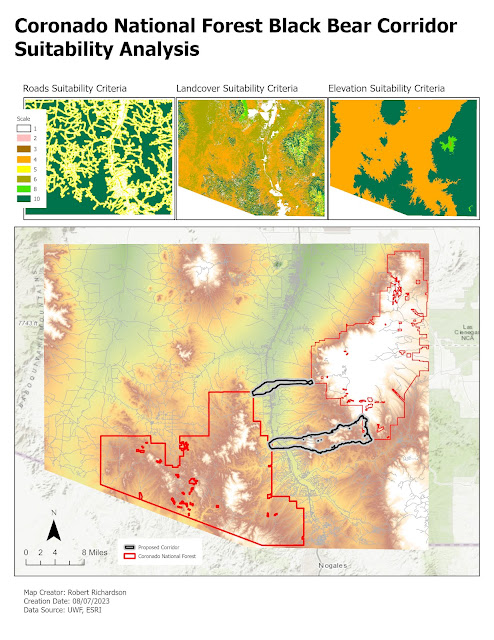
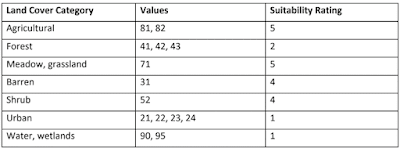
The fourth scenario for Module 6 was to do a Black Bear corridor analysis for connecting the two protected areas of the Coronado National Forest. Black Bear like to stay away from roads, prefer mid-elevation areas, and prefer forest and other vegetation areas. The first step was to create a distance raster for the roads using Euclidean Distance tool and reclassified the raster to the desired suitability values. The elevation and landcover was also reclassified to the desired suitability values. The reclassed roads, elevation, and landcover were then used as inputs to the Weighted Overlay tool produce a raster with a common scale. The scale was inverted to make the higher suitability the preferred trave cost. A cost distance raster was created for each of the two National Forest parts using the inverted suitability raster. The two cost distance raster layers were used as inputs to the Corridor tool which produces the final corridor analysis. The map below shows the proposed corridor a

Module 6 – Suitability Analysis

Image
 One of the scenarios in Module 6 involved performing a suitability analysis for a developer who was looking to purchase some land to build a development. This analysis rated five different criteria to determine the best suitability for the land. The five criteria were land cover, soils, slope, distance from streams, and distance from roads. Below are the 5 criteria and the rating given to different values. A rating of 5 is the most suitable while a 1 is the least suitable. A raster layer for each of the criteria was created based on the suitability rating. The ArcGIS Weighted Overlay tool was used to create a single raster that combined all 5 criteria and multiplied a percentage of influence on each criteria. The map below shows two different approaches to the weighted analysis. The top map shows the approach of equal weight where each category has an equal influence and is given a percentage rating of 20%. The bottom map shows the results of an alternative weight where land cover and

Module 5 – Damage Assessment

Image
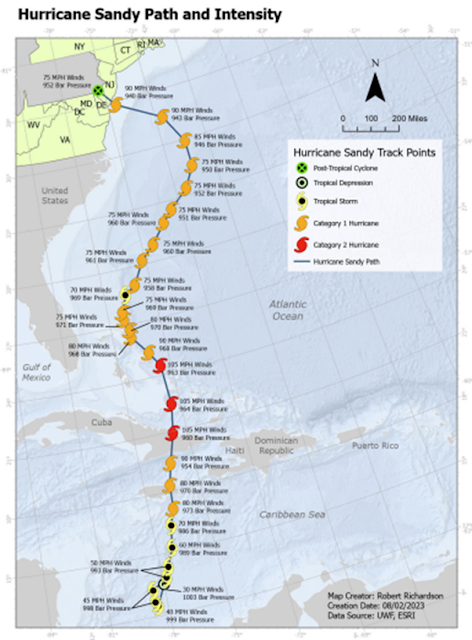
The lab for Module 5 focused on damage assessment near Atlantic City, New Jersey from Hurricane Sandy in October of 2012. We first looked at the path and intensity of Hurricane Sandy shown on the map below. We then used pre-storm and post-storm images to determine the category of damage inside the damage assessment study area. This involved a tedious process of comparing the differences between the before and after images for each building structure. A multiple ring buffer was used to determine how severe the damage was depending on how far it was from the coastline. Summary of Structural Damage and distance from coastline. It makes sense that most of the structures that were destroyed or had major damage occurred within the distance of 100 and 200 meters from the coastline. The data would be more reliable if the tides had been considered in creating the coastline creation. This digitizing step does not consider the tides either at the time the aerial was created or the time the storm