Module 4 – Coastal Flooding
This module discussed the use of Digital Elevation Models (DEM) to delineate coastal flooding and determine storm surge.
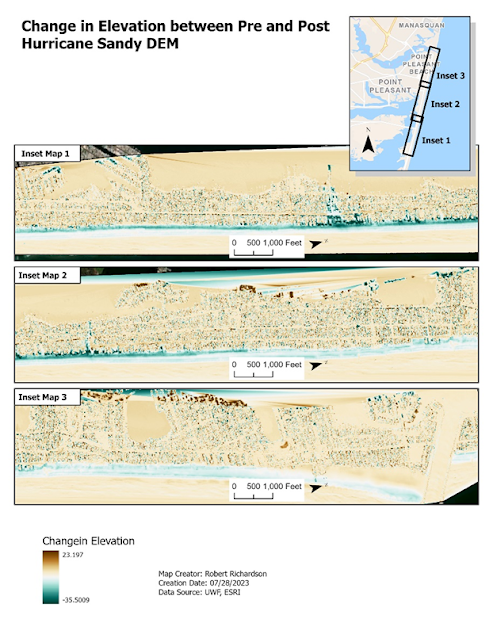
The first part of the lab was to look at the erosion due to Hurricane
Sandy which went through Mantoloking, NJ in 2012. LiDAR files for pre-condition
and post-condition were provided to do the analysis. The two files were first
converted to TIN and then to raster datasets. The Post-condition raster was
subtracted by the pre-condition raster to get the change in elevation between
the two rasters.
Below is a map showing the change raster.
Below is a sample area showing erosion caused by Hurricane Sandy.
The next part of the lab was to look at the effects of storm surge due to Hurricane Sandy in Cape May County, New Jersey. A Digital Elevation Model (DEM) of New Jersey was provided to do the analysis. Hurricane Sandy produced a 2-meter storm surge and utilizing the DEM we can determine the limits of the surge by selecting all areas less than 2-meters.
Below is a map showing the boundary of the storm surge which
affected 46.77% of the county.
The last part of the lab was to compare two different DEM resolutions. The first DEM was created using regular elevation methods with a horizontal resolution of 100 feet. The second DEM was created using LiDAR and produced a high-resolution elevation model with a horizontal resolution of 25 feet.
Below is a map that shows the results of the comparison.


Comments
Post a Comment