Posts

Module 1 Lab: Visual Interpretation

Image
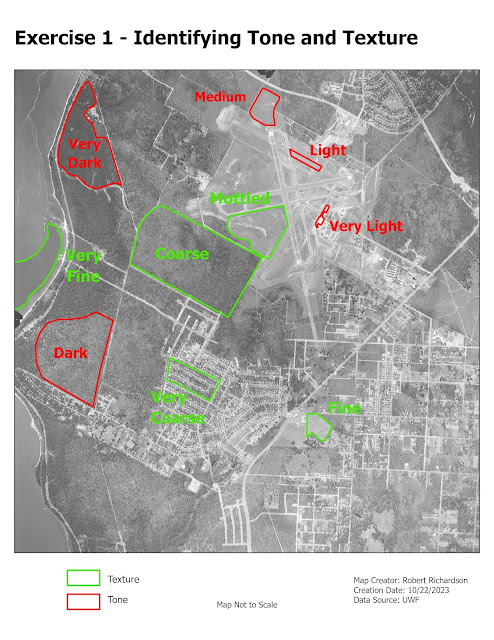
  Visual interpretation is a way of extracting features from an aerial photograph. One technique involves using visual characteristics of an image. These characteristics include size, shape, tone, texture, pattern, and shadow. The first part of the lab involved the use of tone and texture to extract features. The tone element refers to the brightness or color of an object based on the amount of light reflected from an object. Objects that are darker have less light reflected. Objects that are lighter reflect more light. The texture element determines the visual smoothness or coarseness of the image. The variations of tone and texture elements help to bring out different features in the landscape. The map below shows the use of tone and texture to interpret features from an 8-bit aerial image. The next part of the lab was to identify features from an 8-bit black and white image using four different criteria. The four criteria were shape and size, shadow, pattern, and association.  The

Module 2.3: Scale Effect and Spatial Data Aggregation

Image
This module involves the concepts of scale effect on vector data, resolution effect on raster data, and gerrymandering of congressional district boundaries. Scale effect refers to the relationship between how real world of features are represented and the change in accuracy as the scale is changed. The shape of hydrographic features can be represented differently based on the scale and the density of the points collected. The larger the scale, the more detailed and realistic the feature becomes, which increases the length and accuracy of the feature. The numeric results in the table above illustrate that as you go from a larger to smaller scale, the measurements decrease.  The map below shows three different hydrographic datasets that were created at different scales. The smaller the scale the more detailed and closer to realistic representation of the actual hydraulic feature. Resolution effect on raster data refers to the cell size of the grid and how well it represents the true ea

Module 2.2 Surfaces Interpolation

Image
 The lab for this module involved the different techniques to interpolate a surface from a collection of sample points. The techniques discussed in the lab included Thiessen, Inverse Distance Weighting (IDW), and Spline. The Map below shows the elevation points used in the first part of the lab. The map below shows the surface created using the IDW interpolation. The map below shows the surface created using the Spline interpolation using Tension method. The map below shows the difference between the Spline and IDW interpolation with the elevation points overlayed. The illustrates that the points were in systematic pattern where the points are spaced uniformly across the study area. The smallest differences between the two interpolations are around the sampling locations. The differences between the spline and IDW interpolations increase as we move away from the sampling points. The second part of the lab was to compare the uses of different interpolation of a sample of points represen