Module 2 - Forestry and LiDAR
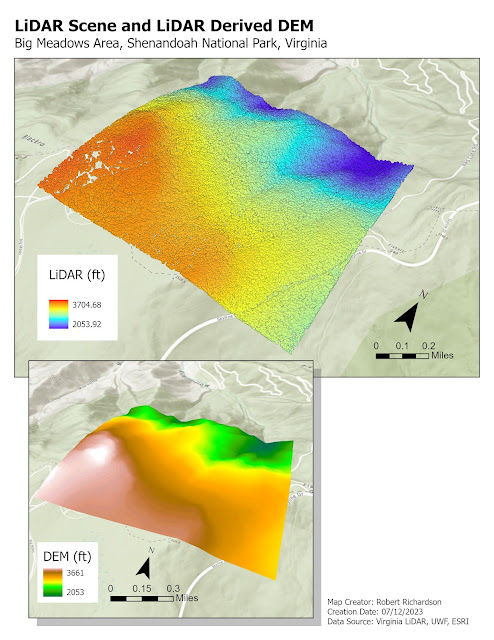
Module 2 involved the use of LiDAR data from the Big Meadows area of Shenandoah National Park in Virginia to determine vegetation biomass above the ground. LiDAR is classified in a way that lets pull out both ground elevation and the top of the trees. By subtracting the two layers the tree heights and density can be calculated.
The below map shows the LiDAR scene where red is higher elevation and blue is lower. The Digital Elevation Model (DEM) shows the ground elevation.
The canopy density map shows the density of the vegetation.
The Tree Heights map shows the tallest trees in dark green
with the tallest tree being 163 feet tall. The chart shows the distribution of
tree heights.


Comments
Post a Comment