Module 5 – Damage Assessment
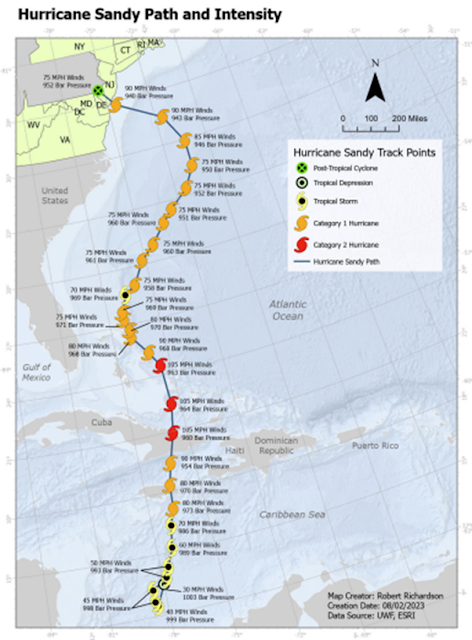
The lab for Module 5 focused on damage assessment near Atlantic City, New Jersey from Hurricane Sandy in October of 2012. We first looked at the path and intensity of Hurricane Sandy shown on the map below.
We then used pre-storm
and post-storm images to determine the category of damage inside the damage
assessment study area. This involved a tedious process of comparing the differences
between the before and after images for each building structure. A multiple
ring buffer was used to determine how severe the damage was depending on how far
it was from the coastline.
Summary of Structural Damage and distance from coastline.
It makes sense
that most of the structures that were destroyed or had major damage occurred within
the distance of 100 and 200 meters from the coastline. The data would be more
reliable if the tides had been considered in creating the coastline creation. This
digitizing step does not consider the tides either at the time the aerial was created
or the time the storm made land fall.


Comments
Post a Comment