Module 2.2 Surfaces Interpolation
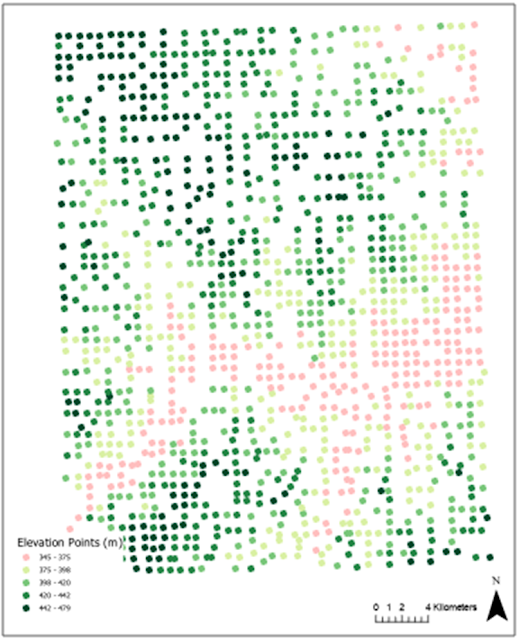
The lab for this module involved the different techniques to interpolate a surface from a collection of sample points. The techniques discussed in the lab included Thiessen, Inverse Distance Weighting (IDW), and Spline. The Map below shows the elevation points used in the first part of the lab.
The map below shows the surface created using the IDW interpolation.
The map below shows the difference between the Spline and IDW interpolation with the elevation points overlayed. The illustrates that the points were in systematic pattern where the points are spaced uniformly across the study area. The smallest differences between the two interpolations are around the sampling locations. The differences between the spline and IDW interpolations increase as we move away from the sampling points.
The second part of the lab was to compare the uses of different
interpolation of a sample of points representing Biochemical Oxygen Demand (BOD)
concentrations in Tampa Bay. The below maps show the results of Thiessen, IDW,
and Spline using both the Regularization and Tension methods.
The results seamed to show that BOD
concentration is the Spline with Tension method. Spline interpolation works
best for small sample size and the Tension method produces a surface where
values closely constrained to the sample data range.


Comments
Post a Comment