Module 6 – Isarithmic Mapping
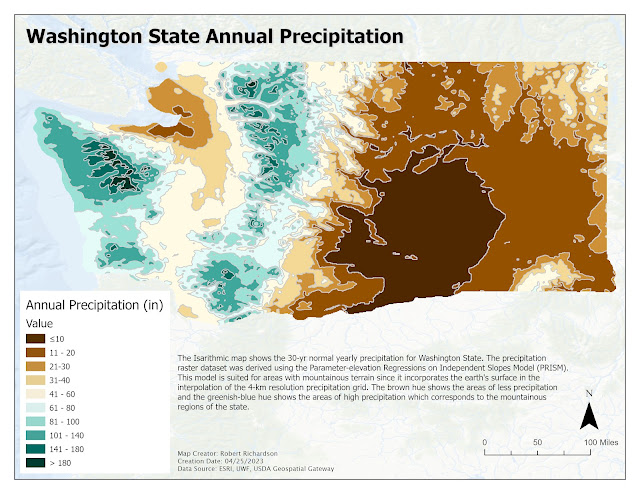
Module 6 Isarithmic Mapping assignment for the Cartography class was to create a map that showed the annual precipitation data for Washington State. ArcGIS Pro was used to create the map using the provided raster dataset that contains the 30-yr normal yearly precipitation for the state of Washington.
The precipitation raster dataset was derived using the Parameter-elevation Regressions on Independent Slopes Model (PRISM). The model incorporates surface elevation, coastal proximity, topographic orientation, vertical atmospheric layers, and other factors into the interpolations. It also includes a dense network of climate monitoring stations that cover the United States.
The isarithmic map utilizes hypsometric tinting which shades a dataset into a stepping interval of colors where the area between contour lines receives the same color tint. The raster dataset values were first converted to integers and then symbolized based on 10 different classifications ranging from elevation <= 10 to elevations > 180. The brown hue shows the areas of less precipitation, and the greenish-blue hue shows the areas of high precipitation which correspond to the mountainous regions of the state.


Comments
Post a Comment